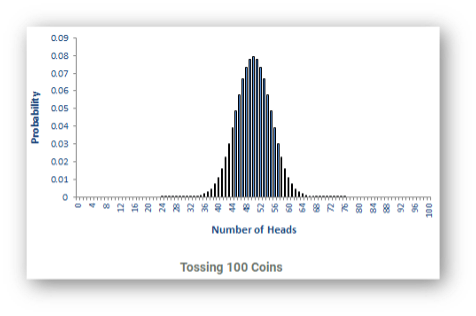
Q: Flip a coin and the result is heads or tails. Flip it 100 times and write down how many times it comes up heads vs tails. What is the outcome?
A: Even odds. Sounds like an oxymoron, doesn't it? The odds of it coming up heads equals the odds of it coming up tails. It's 50-50. Meaning there is a 50% chance of heads and a 50% chance of tails. In Probability and Statistics, this type of experiment represents a Binomial Probability Distribution. Look at that – you conducted an experiment…and you thought you weren’t a scientist!
Figure 1: Probability of Heads with 100 tosses of the coin
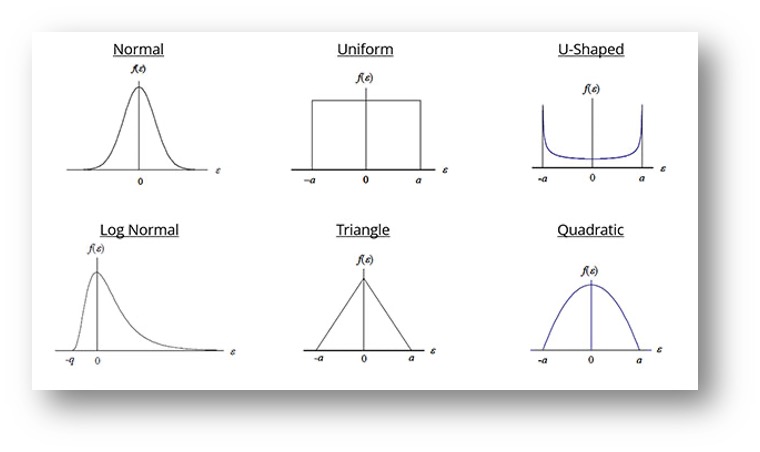
But not every game of chance ends up this way, where there are equal chances of the outcome. There are many different types of Probability Distributions that are used to illustrate various types of events. Specifically related to Metrology, commonly used Probability Distributions1 include the following:
Figure 2: Common Probability Distributions for Metrology Applications
Where are you going?! Come back!! I promise not to get much deeper on Probabilities. Stay with me – here’s what you need to know about all of this. When a calibration is performed, the instrument being calibrated (Unit Under Test, or UUT) is compared to another instrument (Metrology Standard) which is more accurate, so as to identify the error in the UUT and, if needed, adjust it or repair it so it will continue to perform as expected. Speaking of ‘performing as expected’ – the expectation is set by the Original Equipment Manufacturer (OEM) who identifies the UUT’s performance specifications, which sets the tolerances for the calibration. The result is either In Tolerance or Out Of Tolerance (OOT)… actually, there’s more to that story, described later.
There are several factors that can impact each measurement during the calibration. Factors include, but are not limited to, the following:
ambient temperature in the room where the calibration is being performed
relative humidity can play a part too, sometimes
temperature of the standard compared to the temperature of the UUT
cleanliness of the UUT, Standard, and lab environment
vibrations coming through the floor to the work surface, affecting the UUT and/or the Standard
electrical interference being transmitted through the air related to cal of electronic instruments
how level the UUT and Standard are for some calibrations (scales and balances for sure!)
believe it or not, the local gravity can have a big impact on a calibration (weights, scales, balances!)
the OEM specification/tolerances for the Standard being used (usually the largest of all factors)
the measurement uncertainty reported on the Standard’s calibration report
Some of these factors have significant impact while others have a minimal impact on the calibration results, depending on the accuracy of the UUT and the Standard. However, unless you intentionally check to see how much these factors play into the end result, you are not considering everything that needs to be understood in order to account for those biases that can cause an incorrect calibration result. And THAT creates a Quality Blind Spot: not knowing the calibration has been negatively biased and is incorrect.
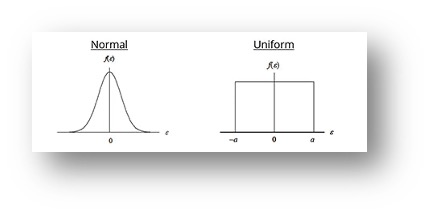
Stay with me – making my point about all of this now. Each one of these factors can be estimated as to how much of an impact each one has on the measurement. And each factor has a Probability Distribution associated with it. Most of them are the Uniform distribution, some are Normal distribution, and occasionally there will be a factor associated with one of the other Probability Distributions shown in Figure 2. We know that, regardless of each component’s distribution type, when we combine these factors (called uncertainty components), the result is a Normal Probability Distribution due to a concept called the Central Limit Theorem. So, when a lab reports a measurement uncertainty, we represent it pictorially as a Normal distribution for this reason. That image is important to remember when we start talking about a Decision Rule. It will also be important to recognize a Uniform distribution, since that is what OEM specs/tolerances typically look like.
Figure 3: Measurement Uncertainty (Normal) and OEM Specifications (typically Uniform)
Specifically related to calibration, the new requirements for accreditation as well as the definition of measurement traceability requires that calibration results must include the reported result and must include the measurement uncertainty for that reported result. The world is finally realizing that reported results carry uncertainty and, therefore, reporting a value without its uncertainty is an incomplete statement as to its true value.
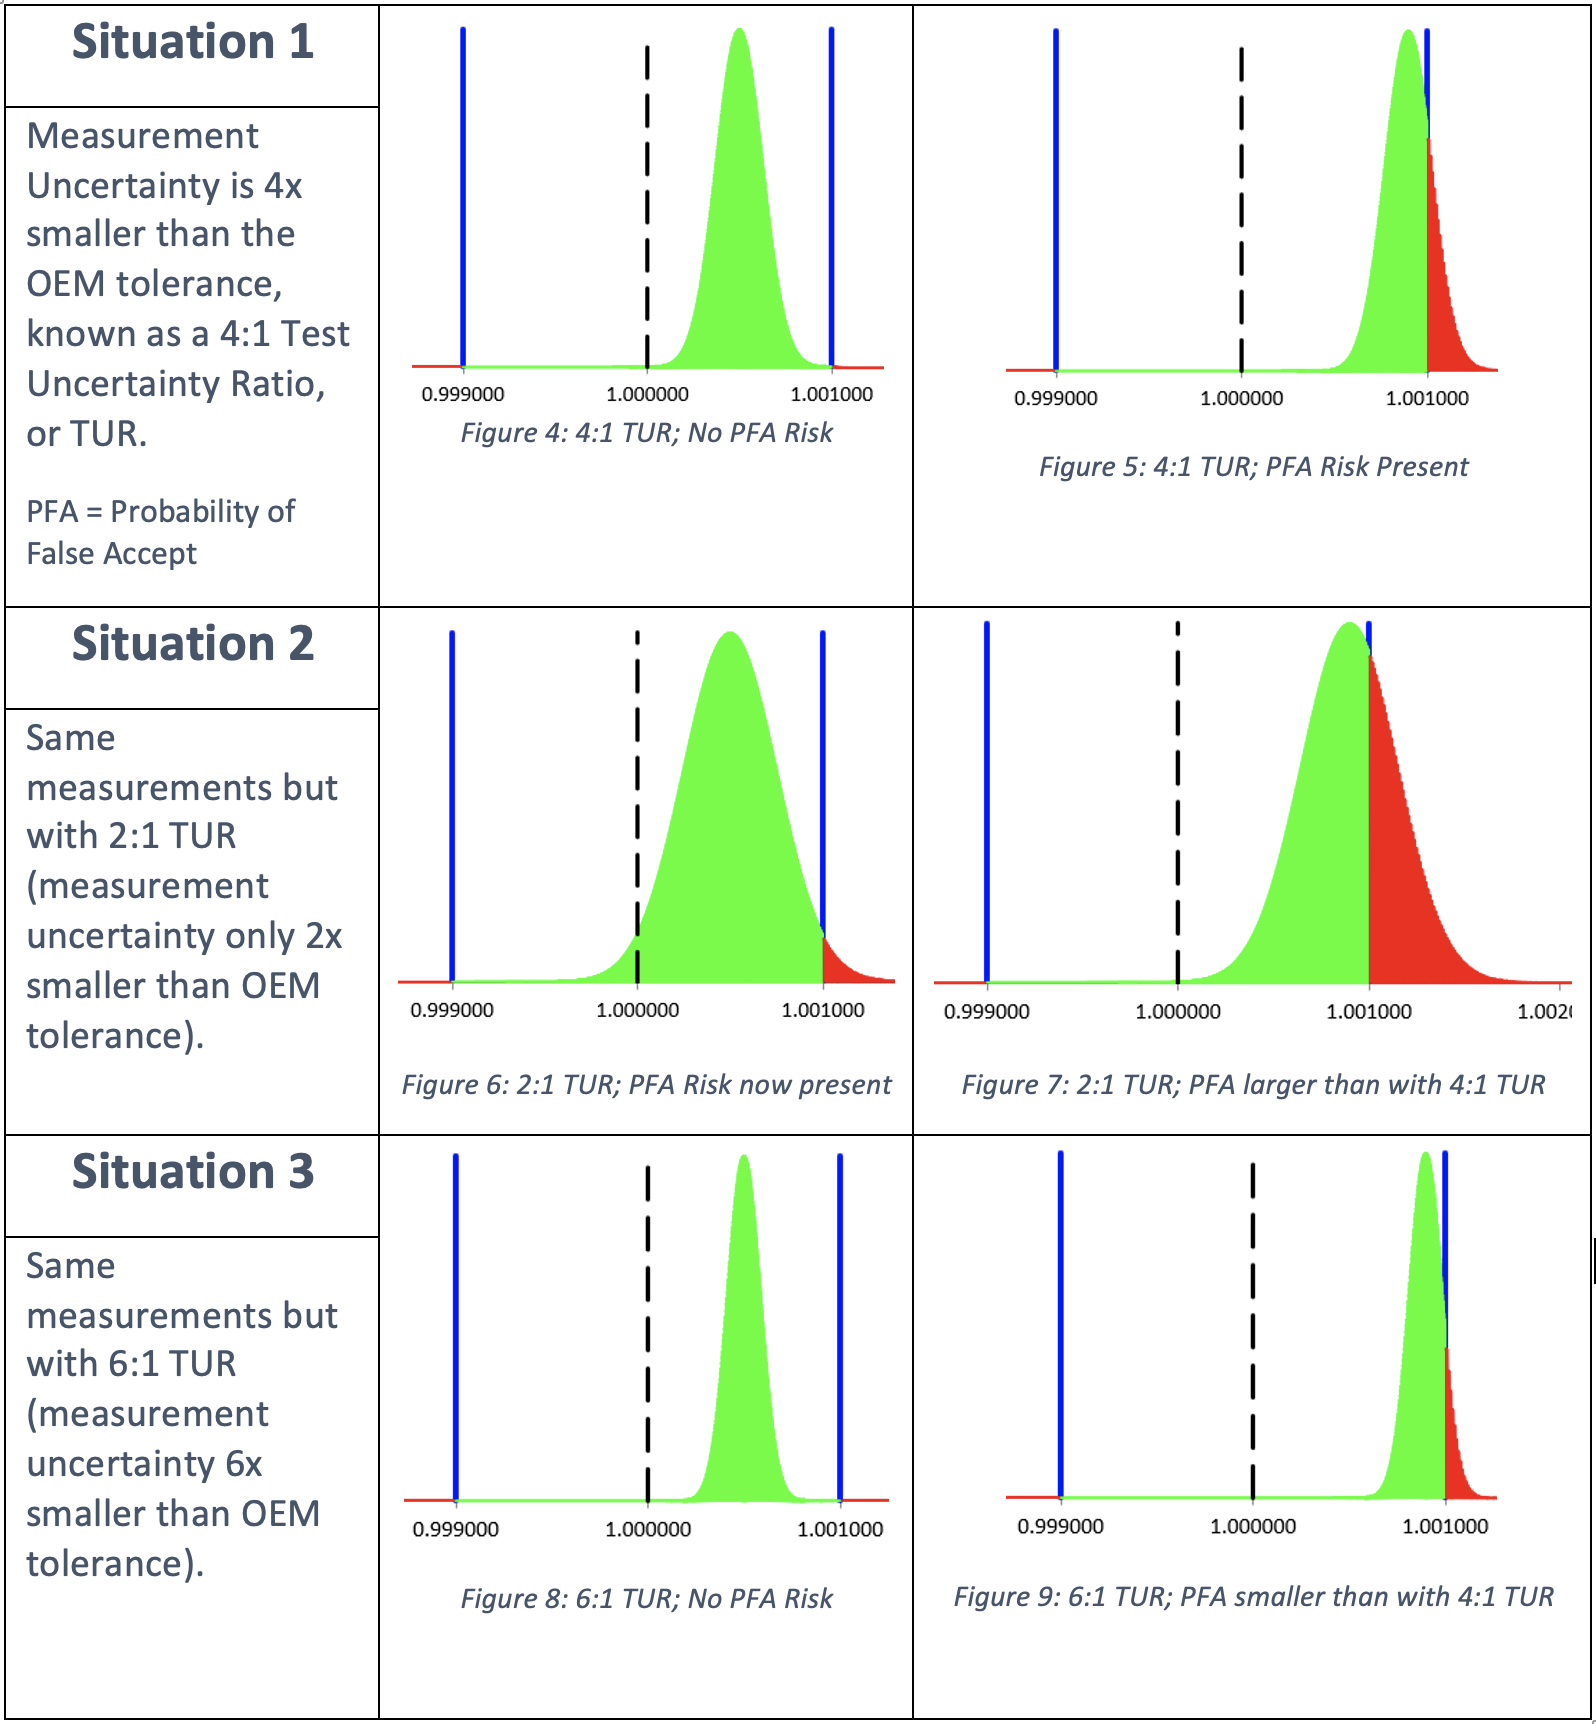
Remember I said there’s more to the story of In Tolerance vs OOT that will be describer later? This is “later”. So now the question is, what do I do with the measurement uncertainty? The answer is that the owner of the instrument must decide what they want to do with it. They must establish a Decision Rule for how to take the measurement uncertainty into account. Why, you ask? Because the measurement uncertainty can be large or small relative to the OEM tolerances and it can impact how sure the lab is in determining In Tolerance or OOT. An important objective in calibration is to ensure the measurement uncertainty is small compared to the tolerance of the UUT. That way, the impact it has on determining In Tolerance or OOT is minimal. Even so, whenever the UUT’s reading is close enough to either end of the tolerance limit, there will be an impact due to the measurement uncertainty. This is where the instrument owner’s Decision Rule comes into play. The following figures provide some insight as to how the measurement uncertainty (Normal distribution; green/red) affects the OEM tolerance (Uniform/Rectangular distribution; blue lines).
The instrument owner can select from a list of pre-defined Guard Banding methods to become their Decision Rule, or they can establish a Custom Decision Rule based on their needs. The client’s Decision Rule tells Transcat what to do with the measurement uncertainties. The Guard Band methods have formulas that will cause you to toss this paper, so I won’t share them here. But, if you just have to know more, please see Transcat’s white paper: Guard Banding 101. All you need to know for now is that the selected Guard Band method creates a second set of tolerances called Acceptance Limits. The OEM tolerances are still used to determine In Tolerance or OOT. But now the Acceptance Limits are used to determine Pass/Fail Acceptance to indicate when more measurement risk is present than is acceptable for the instrument owner. The formulas in the Guard Band methods use the measurement uncertainty to determine how much to reduce the OEM tolerances in order to create the Acceptance Limits. The Acceptance Limits can then be used to identify when the acceptable risk has been exceeded. Usually, the risk is limited to 2% or less.
Transcat’s ISO 17025 accreditation requires us to document each client’s Decision Rule and follow it when taking measurement uncertainties into account. Some clients will say they don’t need this service. That’s okay, we have non-accredited services just for that purpose. But if they do need accredited calibrations, we must capture that information and apply it to their calibrations.
For more information about our decision rules or your calibration requirements, contact one of our calibration professionals at 800-828-1470 or contact us.