Uncertainties for the Common User is a white paper based on a short presentation and discussion on the reporting of measurement uncertainties by calibration laboratories. It will cover measurement uncertainties, how to apply them and why they are important. Realistic examples using electrical and dimensional applications will be used to illustrate the topics covered.
There has been a lot of discussion in the calibration, metrology, and related accreditation communities about “uncertainties” over the past decade. Historically, the measurement uncertainty information was a primary concern for metrology laboratories and calibration laboratories but, due to the globalization of manufacturing, the ever tightening of manufacturing tolerances and the advancement of measurement technology, measurement uncertainty information is reaching the shop floor and the end user by necessity. Often these discussions revolve around concepts described in excruciating detail and are filled with technical terminology and references to statistics. Admittedly, there really is no way around it; calibration and metrology are complex subjects. Considering that, I will attempt to distill the basic idea of measurement uncertainty within the context of what the common end user may see and in terms which are more familiar.
What is Measurement Uncertainty?
The heart of the discussion centers on this simple statement, “… the [measurement] result is complete only when accompanied by a quantitative statement of its uncertainty.” Applying this logic, the following measurement results are considered incomplete: this power supply reads 9.625 Volts; that block is 2.000” in length. Whereas the following results are more complete: this power supply reads 9.625 V ± 0.005 V; that block is 2.000 000” ± 0.000 026” in length. Technically, even these statements are incomplete because they do not identify a coverage factor or a confidence interval, which is all part of that detail that I have purposely excluded from this paper. But for your information, the coverage factor and confidence interval can typically be found in the tiny print or text of a calibration certificate. So what exactly are these additional plus and minus (±) numbers? We first must agree that there are no perfect instruments and there are no perfect measurements, so there is always something “unknown” about every measurement. This “unknown” is defined by calibration accredited laboratories as follows: “Measurement uncertainty is the quantitative evaluation of the reasonable values that are associated with a measurement result. It is a probabilistic expression of the doubt in a particular measurement value.” Now in plain terms this means these additional numbers are the calibration laboratory’s best estimation, in realistic numbers, using scientific and statistical methods. These “unknowns” are formally termed “measurement uncertainties”.
Please note I have yet to use the terms accuracy or error. Although uncertainty, accuracy and error are related terms, they have different meanings in this context and cannot be used interchangeably. Error is the difference [offset or deviation] between the measured value and the ‘true value’ of the thing being measured (also known as the measurand). For example, a gage block may be marked as 2”, but the calibration lab test report states the actual size is 2.0001”, therefore the error of this block is +0.0001”. Whenever possible the lab makes its best attempt to correct for any known errors. Accuracy describes the closeness of the degree of agreement between the measurement result and the “true value”. (Accuracy is a qualitative term only). For our gage block example, the manufacture states they make the gage block to an accuracy of ± 0.0005”, meaning the actual size of the block is expected to fall somewhere between 1.9995” and 2.0005”, which in this case, it does. The accuracy statement describes the expected quality of the block and helps identify the type of measurements it is suited to perform in general. For a complete measurement result for our gage block, the report must include the measurement uncertainty: 2.0001 ± 0.000 004 1”. We now have some quantitative knowledge of our gage block’s actual length.
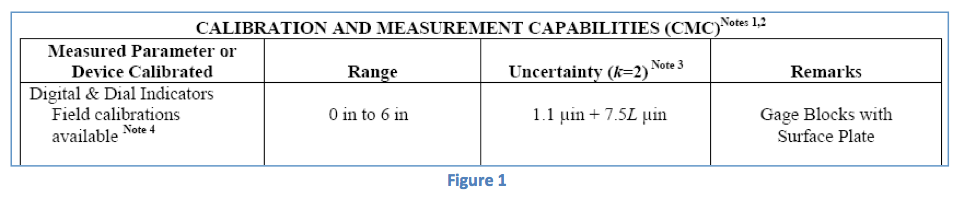
To understand an accredited laboratory’s calibration and measurement capability (CMC) (i.e., their best measurement uncertainty) you should examine their published Scope of Accreditation. A typical scope of accreditation will look like this:
Appendix A has 3 full-page examples of different Scopes of Accreditation. These documents quantify the laboratory’s best or smallest uncertainty achievable. The ‘scope’ (as we informally call them) is published so customers can determine whether the laboratory has the ability to perform the calibration activity suitable for their equipment. As a side note, the uncertainty published on the scope of accreditation may not match the uncertainty on your calibration report for your measurement equipment; you may get a larger measurement uncertainty because the “best” uncertainty a lab can achieve is often overkill for most equipment. This doesn’t mean you received a “bad” calibration, in all likelihood the lab still followed Good Metrology Practices (GMetP) and followed the infamous 4-to-1 rule (meaning their calibration process is 4 times better than your test equipment) which is accepted industry-wide as the minimum target of calibration.
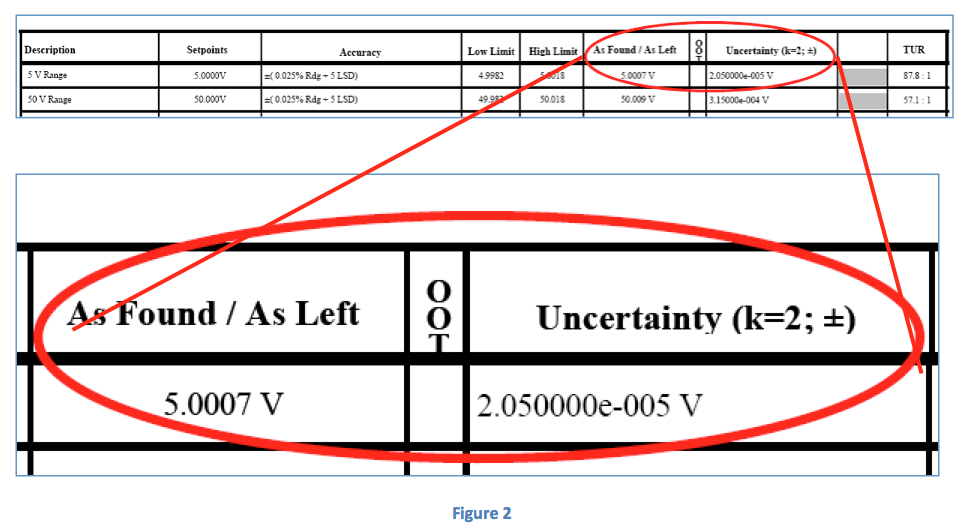
When you send in your units for calibration, what you will receive will look something like the data report excerpt shown in Figure 2. These are the actual uncertainty values for the specific measurement reported by the calibration lab. This is the information you will need when you conduct your uncertainty assessment. In this example, the measurement taken was 5.0007 Volts, and the laboratory has a ± 0.000 020 5 Volt margin of uncertainty around that specific value.
Why it's important to understand Measurement Uncertainty
You should be familiar with measurement uncertainties if you a performing any type of calibration on any devices that will, in turn, be used to perform other process measurements. This can be thought of as the domino effect: any uncorrected errors and all uncertainties in the calibration measurement process will be passed down to all the measurements made by the calibrated device. This is a critical component of metrological traceability. Another case where uncertainties can be important is during an acceptance/rejection process. If the uncertainties in the testing instrument and the measurement process are large enough, there can be serious economic impact with falsely accepting bad product or falsely rejecting the good product, not to mention the potential safety impact this can have. These implications increase significantly as potential nonconforming parts move through the assembly process, into the final product and to the end customer.
As mentioned earlier, there are no perfect measuring instruments, which also applies to instruments used in the manufacturing process. Taking actual measurements is also a process in and of itself, there is more to the process than just the quantity to be measured and the measuring instrument. There are many sources of potential error which even a quick error assessment can identify. A few of sources of error to consider are the measurement device and its calibration, test leads, connectors, cables, leads, and switches. One should also consider the measurement environment: ambient temperature, pressure, and humidity can all be sources of error. A few less obvious environmental errors can be associated with air quality, particulate contamination and lighting conditions, and believe it or not, altitude and gravity. Then you should consider some less obvious sources such as software programs and their resolution limitations, signal conditioning, signal digitization and unit of measurement conversion factors. And finally, consideration must be given to the operator. Some measurement techniques require highly skilled operators and require the operator to make interpretations, interpolations or make judgment decisions. This is especially true with dimensional measurements where Gage R&R studies are often completed to quantify and hopefully compensate or correct for these potential errors. Commonly, many of these potential sources of error will have an affect your measurement process. It depends upon your process requirements, what you are measuring, how accurate you need to know the measurement and other factors. The bottom line is: get to know your measurement process! Any error whose value we do not know (the ‘unknown’) is a source of uncertainty. For example, we have an old 2” Gage Bock that was sent for calibration and the calibration data report states it to have an actual length of 1.978 122” ± 0.000 008” at 68°F ± 1°F. What we don’t know is the actual length after 6 months of heavy use on your shop floor which is 75°F ± 10°F when sitting on a surface plate being used as a reference during a height transfer technique that also uses an indicator head, a gage amplifier, and a height gage. There are at least 10 sources of potential measurement errors in that last sentence; can you identify them all? If you miss any, what impact will it have on your product’s safety or cost? If you’re not currently taking into account any sources of error, then you might approach this another way: what are some of the common production problems your company is experiencing? Are any of them related to potential sources of error that have not been taken into consideration? Transcat offers consultation that reveals sources of error in the measurements you take with your instruments and can help you to understand how this impacts quality decisions in your production process.
How Measurement Uncertainty impacts your test equipment and procedures
In the calibration lab, we follow some very detailed and specific procedures when conducting error analysis and developing uncertainty budgets, such as the Guide to Uncertainties of Measurement (GUM) and NIST Technical Note 1297. These analyses can be very time consuming and require a very high level of expertise in the appropriate field of knowledge. The end result of these guides is what we call an Uncertainty Budget (see Appendix B for examples). I am not going to explain these in any detail; they are only presented for informational purposes and we offer other white papers and training that go into those details. If you are curious about further detail, I have included a list of documents for further reading. I highly recommend Stephanie Bell’s “A Beginners Guide to Uncertainty of Measurement”, available free online through the National Physicals Laboratory (NPL) which is the United Kingdom’s equivalent of NIST.
If you look over the sample Electrical Uncertainty Budget, there are only 3 major components: the unit’s specifications, the measurement uncertainty associated with the calibration of the unit, and the repeatability of the measurement process. There are 2 minor components covered in the note at the bottom: a minimum noise floor and thermal EMF due to the test leads. Overall it is pretty straightforward as far as the components are concerned. I have completely glossed over the statistics and the method of combining the components used to generate the final uncertainty value. Again, this is an introduction and not meant to cover those details.
Now please look over the sample Dimensional Uncertainty Budget. It has a few more components, but did you pick up on the largest source of uncertainty? It is (ΔL Temp 68°F Δ3°F) which is the temperature variation in the room; it swings a maximum of 3°F. This budget is for the calibration of micrometers, imagine what the uncertainties would be if you calibrated a micrometer on a shop floor with temperature controls swinging 5°F or 10°F!
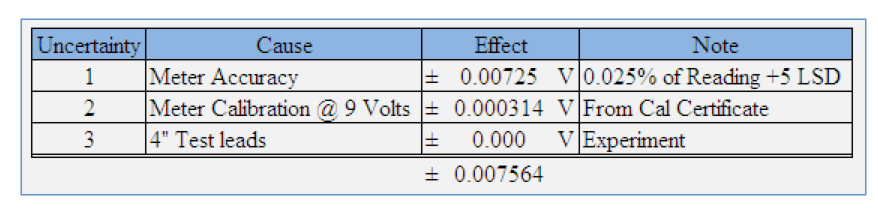
Now it isn’t necessary to go to all the detail as shown in the example budgets to get started. As the old saying goes, how do you walk 1,000 miles…. one step at a time. What is presented here can be thought of as a rough-order-of-magnitude error assessment. At this point, all you want to do is identify the real sources of potential error. I have found one of the best tools is to draw a picture of the measurement process and then step back and look it over for potential sources of error. For example, let say our process says to check the power supply and it must read 9.00 Volts ± 2.00 Volts, meaning the power supply has to read between 7.00 and 11.00 Volts. You are simply using a Digital Multimeter and a set of test leads. You list the sources of possible error in a chart and simply add up the measurement effect.
As you can see from the chart the largest source of uncertainty is from the Accuracy specification of the multimeter, while the calibration uncertainty is about 25 times smaller, and the test leads really have no impact at all. From this assessment, you may conclude that the process is suitable for making the 9.00 ± 2.00 Volt measurement since the multimeter cannot reasonably read to ± 0.008 Volts (due to the resolution of the meter and rounding). However, you can also see that if your test results turn out to be 6.99, 7.00, 7.01 (near the lower process limit) or 10.99, 11.00, or 11.01 (near the upper process limit) your measurement process may not be telling you the correct value due to the analysis you conducted. You may be falsely accepting bad product or falsely rejecting the good product if the meter indicates values near these limits. At this point, it is a business decision as to what happens next. Are these questionable readings posing an acceptable business risk? How many units actually have readings in these areas of uncertainty? There are many such non-measurement related factors that should be considered in business risk decisions. If the business risk is unacceptable, then you may need to take the next step and learn how to complete an uncertainty analysis following acceptable practices or take some other process improvement steps in order to remove the unacceptable risk.
The simple example above is far from a true uncertainty budget like the examples in the appendix of this paper, but it does introduce the use of the Calibration Uncertainty into the context of the manufacturing process and provides a method to generate sound information on which to base business decisions intended to remove doubt.
Conclusion
Don’t take unnecessary risks; understand the limitations posed by unknown sources of error and take action to remove them or reduce them to an acceptable level. Ask for help if you need to, but don’t leave it alone and hope it goes away. Phil can fill in the rest of this summary. He is an excellent resource for this type of knowledge; some call him a Subject Matter Expert (SME). I call him a Phil-osopher!