

Calibration of CMM Probe Qualification Sphere:
Is this Critical for Achieving Accurate and Precise CMM Measurements?
The competition amongst manufacturers in today’s world is primarily due to the extensive changes that have been applied to the quality assurance standards. Companies adhere to quality practices and are striving to deliver top-notch products by maintaining superior quality standards. Co-ordinate measuring machines are widely used in a variety of metrology applications and play a vital role in helping companies achieve exceptional quality products. The different mechanical parts of the CMM function together to measure the manufactured parts precisely and accurately. Stylus or probe is the first part of CMM that contacts the work piece under inspection. The different tips of a stylus need to be qualified before they can be used in a part inspection program. The probe qualification typically comprises of finding the effective radius of the probe tip, lengths and orientations of the stylus and errors associated with the probing system (coefficient of elastic bending of the probe). Probe qualification spheres are used to qualify the stylus used in part inspection programs. The form and Sphericity variation of the probe qualification sphere is critical for the CMM probe qualification process. The calibrated size of the sphere should be inputted to the CMM software during the probe qualification process. This paper studies the effects of probe qualification sphere size on the CMM measurements. A master ring gage and a hole plate was measured with a 3x55 mm size stylus tip which was qualified using different probe qualification sphere sizes and compared against each other for size variations. This paper addresses the dilemma “Is calibration of the probe qualification sphere essential?” that exists widely in the metrology industry.
Introduction
Coordinate measuring machines are extensively used in various industries such as automotive, Aerospace, Medical Device, etc. CMM’s are widely used to reduce downtime and the cost associated with the inspection process. CMM’s can measure parts with better repeatability and uncertainties when compared to manual open setup inspections. The complexity of setups required to inspect a part using manual open setup is eliminated upon inspecting on a CMM with an articulating probe head. A tedious inspection is required and essential when any GD&T call-out is used on a part drawing. For instance, a Flatness [1] call-out on a part drawing would require the use of a leveling plate, and a dial test indicator for an open setup inspection. The open setup inspection requires manually leveling the surface for which the flatness is called out, by isolating the errors associated with the surface. A CMM inspection to verify flatness of the same part would require the surface to be measured by taking several hits on the surface. A plane is constructed using fitting algorithms [2] which aids in finding the flatness measurement. A CMM inspection with the help of CAD data and fitting algorithms is usually required when profile of a surface is called out on any part drawing with a contour surface or radius. Part inspection is simpler, automated and less time consuming when parts with GD&T requirements, on the drawing is subjected to CMM Inspection. The advantages of using CMM’s for inspection are not limited to the above-mentioned reasons. There are various key elements of a CMM that functions as a system and assists in collecting the required coordinate data from the part surface and features, that are subjected to inspection and provides the collected information to the CMM controller. The probing system is one of the main components of a CMM that assists in gathering the part coordinate data, and stylus is part of the probing system that first comes in to contact with the part.
1.1 Stylus:
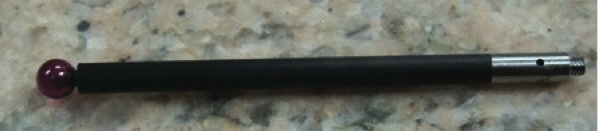
The CMM uses a stylus to contact the part under inspection to collect data. The stylus shown in Figure 1 has a ruby ball which is the contact tip and a stem made of carbon fiber.
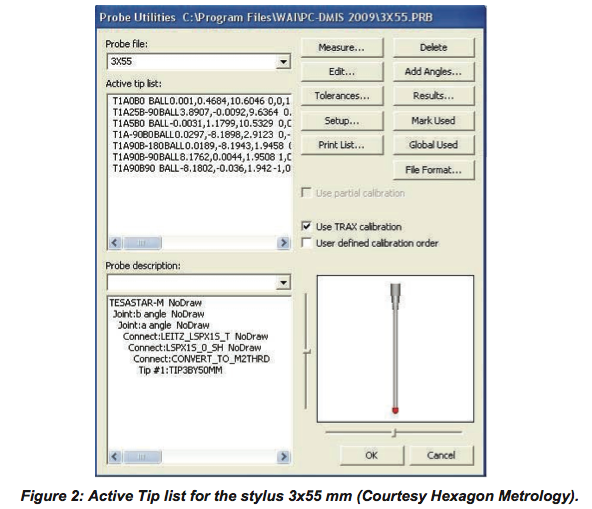
The first step in developing a CMM program is to select the correct stylus size (length and diameter) and add the different tips needed to accurately inspect the part features without moving the part and re-aligning the coordinate system. The stylus defined for appropriate orientation of the rotary axes A and B of the CMM are the different tips that can be used in a part inspection program. For example, a stylus of 3x55 mm size can have several tips configured for different orientations of the A and B axes, such as A0B0, A90B-90, etc., as shown in Figure 2, provided, all the tips are qualified during the probe qualification process.
1.2 Probe Qualification:
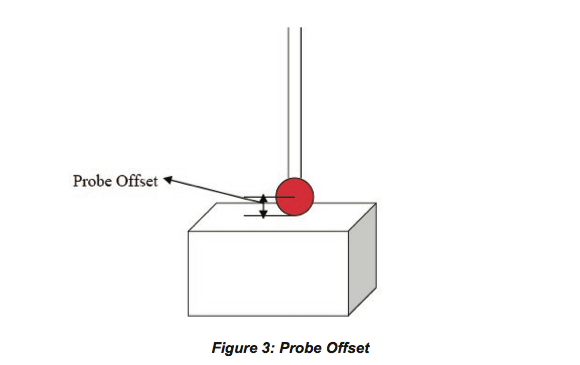
Probe qualification program is used to find the effective radius of the stylus tip which is an essential step prior to measuring any part using CMM, since, the probe tip’s center location in relation to the machine’s coordinate system must be determined. When stylus contacts the part surface, it’s the circumference of the stylus tip that touches the part to record measurements as shown in Figure 3. Once the effective radius and center of the tip are determined using the probe qualification process, the tip’s radius is mathematically offset from the center coordinates of the stylus tip to the tip’s point of contact with the part surface. The alignment procedure determines the direction of the offset.
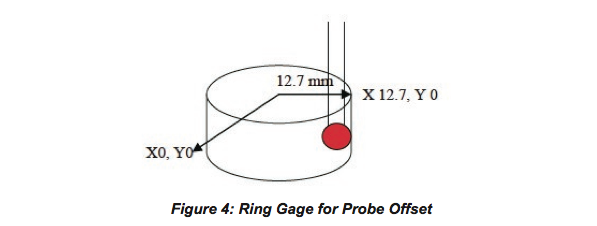
For instance, as shown in Figure 4, when a 25.4 mm ring gage is measured along the +X direction, using a 3 mm stylus tip with 1.5 mm effective radius, the center of the ring gage being the x, y origin and top surface of the ring gage being the z origin, the radius of the stylus tip (1.5 mm) is offset from the tip’s center to the tips point of contact on the ring gage which results in a point with (12.7,0) as the x, y coordinates for a CMM vector hit (1, 0, 0).
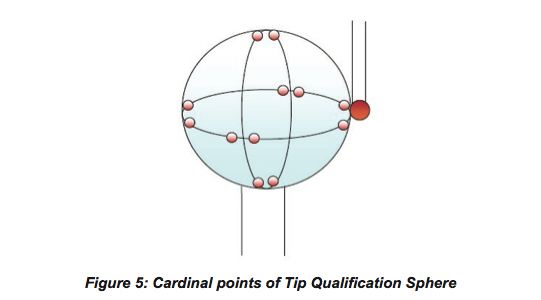
The effective radius and center of the stylus tip are determined by measuring a high precision calibrated sphere of known size. CMM determines the size of the sphere by taking several hits on the sphere along the cardinal points as shown in Figure 5. The difference between the sphere size determined by the CMM and the actual calibrated size of the sphere inputted to the CMM software during the probe qualification process determines the effective stylus tip radius. The probe qualification process also considers the length of the stylus, co-efficient of stylus bending and pre-travel of the stylus.
The next section discusses about the probe qualification sphere and the calibration process of the sphere.
1.2 Probe Qualification Sphere:
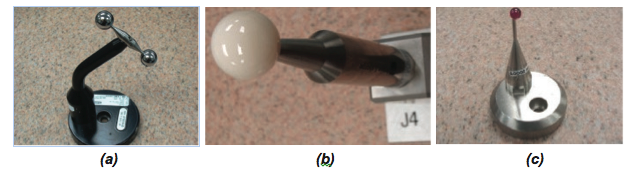
Probe qualification spheres are usually made of steel, ceramic, ruby, etc as shown in Figure 6. The calibration spheres are mounted on the CMM table to perform probe qualification.
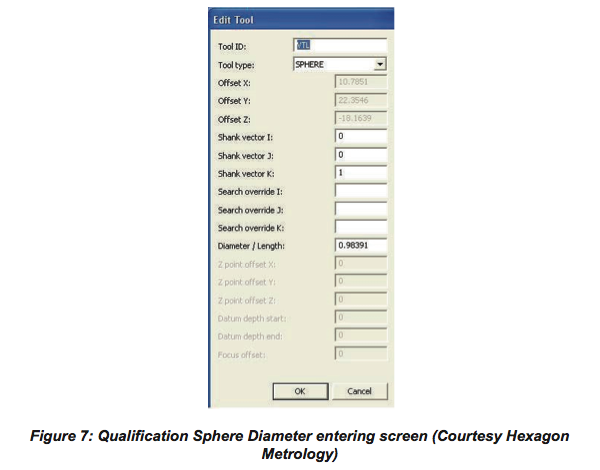
Before starting the probe qualification, the calibrated diameter of the sphere is inputted to the CMM software as shown in Figure 7, which is a screen shot of the PCDMIS software where the qualification sphere size has been inputted.
1.3.1 Calibration of Probe Qualification Sphere:
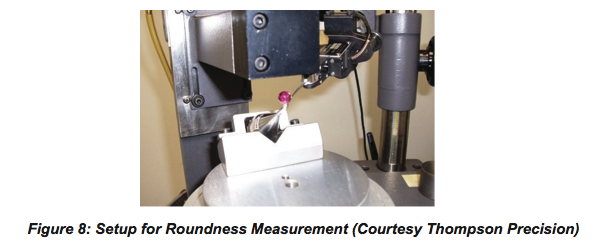
The probe qualification sphere is calibrated for size, sphericity or Roundness [1, 4] and surface finish [3, 4]. In this study to understand the calibration process of sphere’s, upon request, Thomson Precision calibrated the size of the 8.0 mm ruby and 25.4 mm steel sphere’s as shown in Figure 6 (a) and (b). Each sphere was compared to a corresponding master ball calibrated by NIST. The unreformed average diameter was determined by measuring at least 15 planes between two flat and parallel tungsten carbide surfaces with 4 oz. The roundness was measured using a form measuring machine like federal forms can roundness machine in three great circle planes: at the equator, 0.5 mm above and below the equator. Figure 8 shows the setup for measuring an 8.0 mm ruby qualification sphere used in a multi sensor CMM.
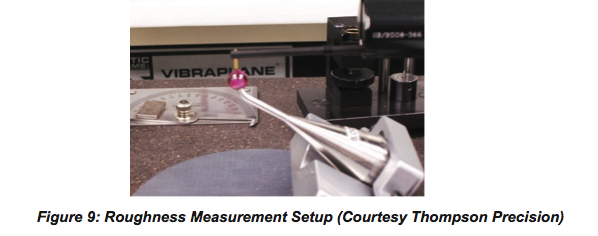
The surface finish of the sphere was measured using a profilometer like Taylor Hobson Form Talysurf machine. Figure 9 shows the setup for measuring the average Roughness (Ra) on an 8mm ruby qualification sphere used on a multi sensor CMM.
2. Data Analysis:
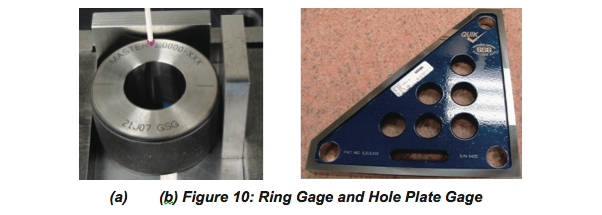
To find the significance of the sphere diameter over the CMM measurements, a 25.4 mm ring gage as shown in Figure 10(a) and a hole plate as shown in Figure 10(b) were measured with a 3x55 mm stylus tip for three different values of the probe qualification sphere: 24.99131 mm, 24.99258 mm and 24.99385 mm. The probe qualification sphere used in this study is made of ceramic as shown in Figure 6(b) and the nominal size is 24.99131 mm. The measurements on the ring gage and the hole plate were taken on a Brown&Sharpe Global advantage CMM with a Tesa-Star probe head which can perform both touch trigger and constant touch measurements. Per Brown&Sharpe, the MPE per ISO 10360-2 for this CMM is (1.5+L/333) μm.
The probe qualification sphere was mounted on the CMM table where the ring gage and hole plate were measured. For each value of the sphere, the ring gage and hole plate were measured for 30 runs each, without changing any other parameters. The setup of the ring gage and hole plate measurements are explained in detail in the following sections.
2.1 Ring Gage:
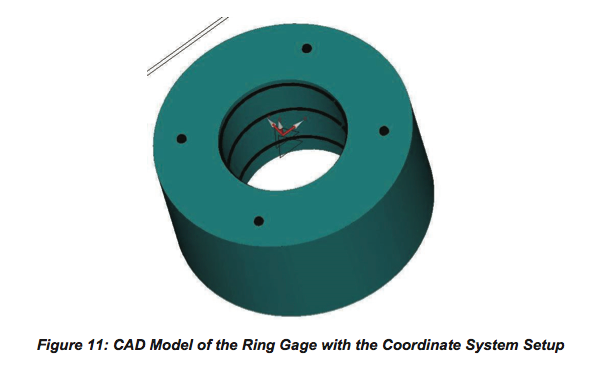
The ring gage used in this study is a 25.4 mm class XXX master ring. The diameter of the ring gage as shown in Figure 10(a) was measured at three different heights, with 1.016 mm distance between each step. A CAD model was used to program the ring gage using Brown&Sharpe PCDMIS Software. The coordinate system setup of the CAD model is shown in Figure 11. The x, y origin is at the center of the ring gage and z origin is at the top surface.
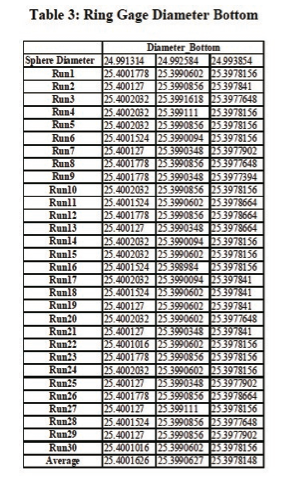
The diameters were measured at three different heights from the top surface. A continuous scanning probe was used to measure the diameters at the different heights. Approximately 92 points were collected to find the diameter at each level. Before starting the measurements on the ring gage, the tip qualification program was run using the nominal value of the sphere (24.99131 mm). The ring gage was measured for the three different diameters (top, middle, and bottom) for 30 runs and the results were recorded. Then the tip qualification program was run again by increasing the spheres nominal size by 0.00127 mm. The ring gage measurement was repeatedly taken 30 times at three levels and the results were recorded. Now the tip qualification program was run again by increasing the spheres nominal size by 0.00254 mm. The ring gage measurement was repeated as mentioned for the previous run. The results were recorded as shown in Table 1 for top, Table 2 for bottom, and Table 3 for bottom of the ring gage.
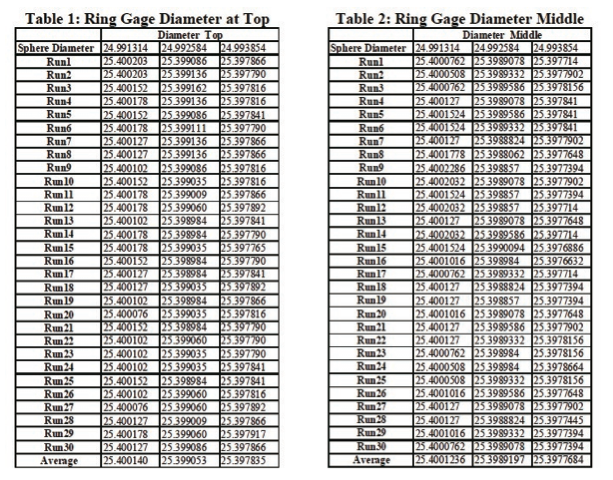
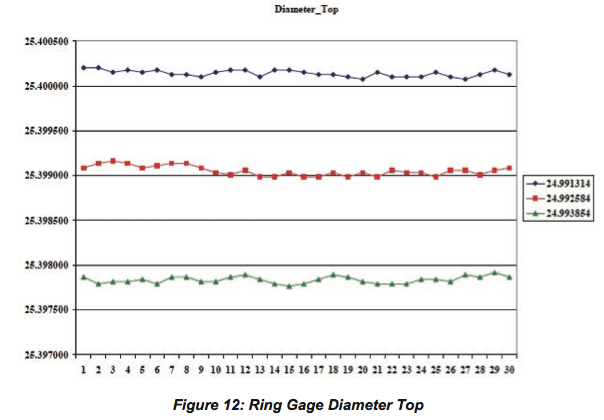
For diameter measured at the top of the ring, the difference between the average diameters of the ring gage measured using the nominal value of the sphere and (nominal+0.00127mm) value of the sphere was 0.001087 mm, which is an 85.6 % difference between the average diameter value, for a 0.00127 mm change in the sphere size. The difference between the average diameters of the ring gage measured using the nominal value of the sphere and (nominal+0.00254 mm) value of the sphere was 0.002305 mm, which is a 90.6% difference between the average diameter values, for a 0.00254 mm change in the sphere size.
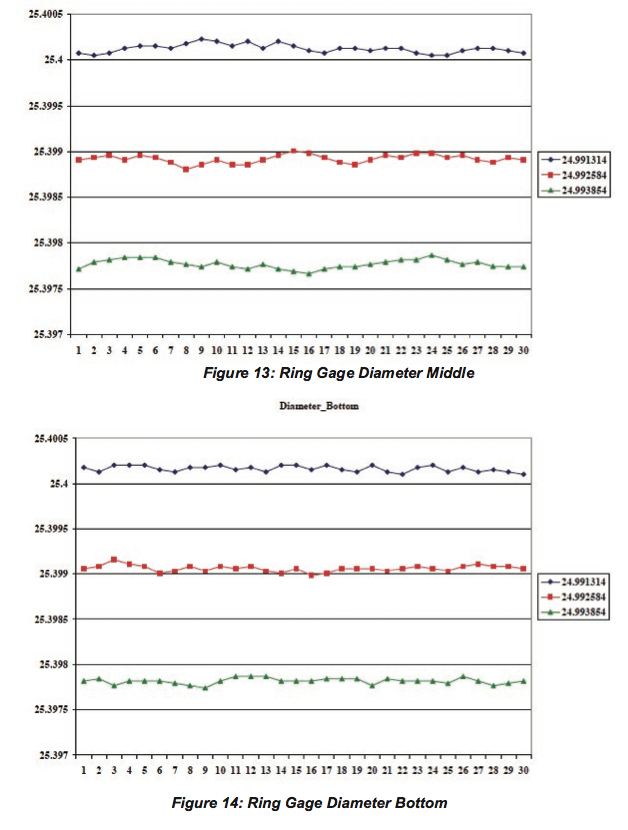
For diameter measured at middle of the ring, the difference between the average diameters of the ring gage measured using the nominal value of the sphere and (nominal+0.00127mm) value of the sphere was 0.001204 mm, which is a 94.8 % difference between the average diameter values, for a 0.00127 mm change in the sphere size. The difference between the average diameters of the ring gage measured using the nominal value of the sphere and (nominal+0.00254 mm) value of the sphere was 0.0024 mm, which is a 92.5 % difference between the average diameter values, for a 0.00254 mm change in the sphere size.
For diameter measured at bottom of the ring, the difference between the average diameters of the ring gage measured using the nominal value of the sphere and (nominal+0.00127mm) value of the sphere was 0.00109 mm, which is an 85.8 % difference between the average diameter values, for a 0.00127 mm change in the sphere size. The difference between the average diameters of the ring gage measured using the nominal value of the sphere and (nominal+0.00254 mm) value of the sphere was 0.00235 mm, which is a 92.5 % difference between the average diameter values, for a 0.00254 mm change in the sphere size. The actual diameters of the ring gage were plotted for each value of the sphere for top, middle and bottom of the ring gage as shown in Figure 12, Figure 13, and Figure 14 respectively.
2.2 Hole Plate Gage:
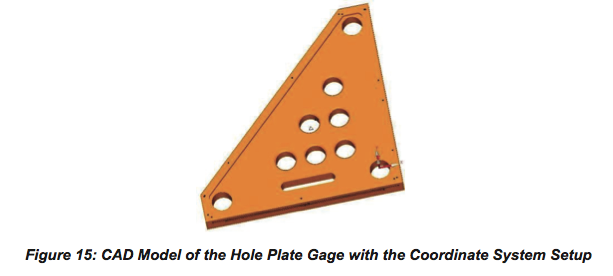
The hole plate gage used in this study consists of three 25.654 mm holes arranged in a triangular pattern as shown in Figure 10(b). The three diameters were measured using a CAD model. The program was created using Brown&Sharpe’s PCDMIS Software. The coordinate system setup of the CAD model is shown in Figure 15. The x, y origin is at the center of the bottom right diameter and z origin is at the top surface.
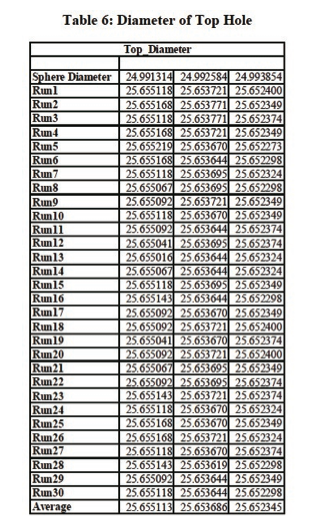
The diameters were measured at the same height from the top surface. A touch trigger probe was used to measure the diameters. A total of 12 points were measured to find the diameter of each hole. Before starting the measurements on the hole plate, the probe qualification program was run using the nominal value (24.99131 mm) of the sphere. The hole plate was measured and the results were recorded for the three different hole diameters (top, bottom left, and bottom right) for 30 runs. Then the probe qualification program was run again by increasing the spheres nominal size by 0.00127mm. The hole plate gage measurement was repeated 30 times and the results were recorded. Now the tip qualification program was run again by increasing the spheres nominal size by 0.00254 mm. The hole plate gage measurement was repeated as mentioned for the previous run. The results were recorded as shown in Table 4 for bottom left, Table 5 for bottom right and Table 6 for top holes of the gage.
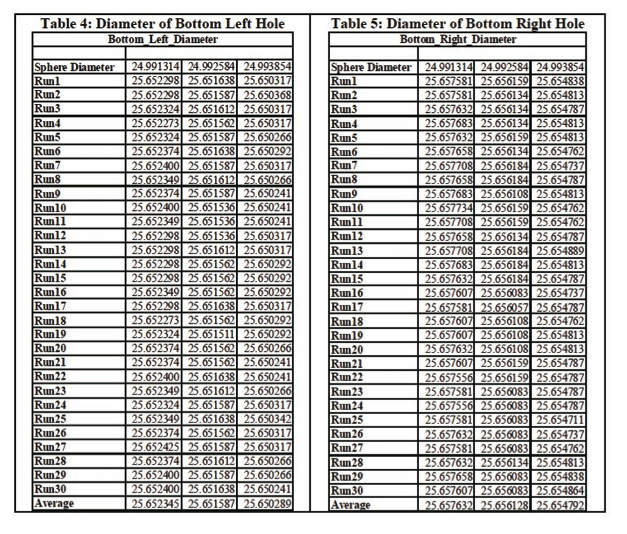
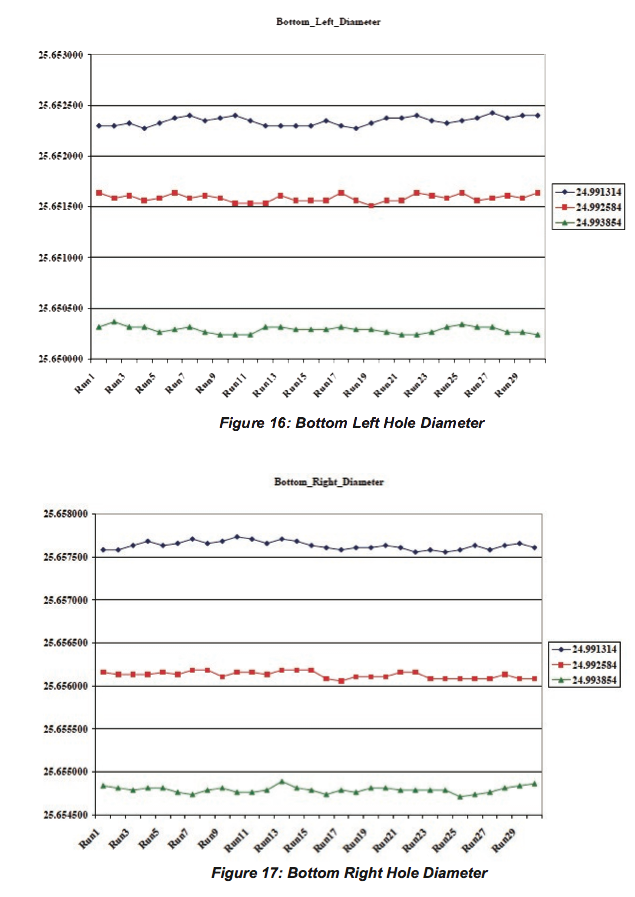
For bottom, left hole diameters measured, the difference between the average diameters of the hole using the nominal value of the sphere and (nominal+0.00127mm) value of the sphere was 0.00076 mm, which is a 59.7 % difference between the average diameter values, for a 0.00127 mm change in the sphere size. The difference between the average diameters of the hole using the nominal value of the sphere and (nominal+0.00254 mm) value of the sphere was 0.002056 mm, which is an 80.95 % difference between the average diameter values, for a 0.00254 mm change in the sphere size.
For bottom, right hole diameters measured, the difference between the average diameters of the hole using the nominal value of the sphere and (nominal+0.00127mm) value of the sphere was 0.001505 mm, which is a 118.5 % difference between the average diameter values, for a 0.00127 mm change in the sphere size. The difference between the average diameters of the hole using the nominal value of the sphere and (nominal+0.00254 mm) value of the sphere was 0.002841 mm, which is a 111.9 % difference between the average diameter values, for a 0.00254 mm change in the sphere size.
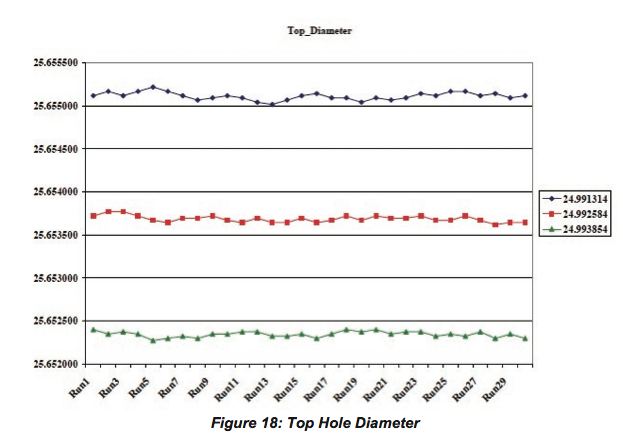
For top hole diameters measured, the difference between the average diameters of the hole using the nominal value of the sphere and (nominal+0.00127mm) value of the sphere was 0.001427 mm, which is a 112.4 % difference between the average diameter values, for a 0.00127 mm change in the sphere size. The difference between the average diameters of the hole using the nominal value of the sphere and (nominal+0.00254 mm) value of the sphere was 0.0028 mm, which is a 110 % difference between the average diameter values, for a 0.00254 mm change in the sphere size. The actual diameters of the hole plate gage were plotted for each value of the sphere for bottom left, bottom right and top holes respectively as shown in Figure 16, Figure 17, and Figure 18.
Conclusion:
The results from the ring gage and hole plate measurements discussed in the prior sections clearly indicates that the CMM measurements were affected by the sphere size inputted during the probe qualification process. Since the effective radius of the stylus tip is calculated during the probe qualification process, the uncertainty associated with the sphere size is transferred to the CMM size measurements, thus the need to find the sphere size accurately is evident. A traceable calibration of the probe qualification sphere will eliminate the uncertainty on the sphere’s size, and form information. But there has always been a question on the necessity of calibrating the probe qualification sphere since it contacts a stylus tip made of low wear resistance material like ruby, silicon nitride, zirconia, ceramic, or tungsten carbide. Also the sphere itself is made of ceramic, stainless steel, ruby and so on. The results of ring gage and hole plate diameter measurements in this paper, provides the evidence and the necessity to calibrate the probe qualification sphere to determine the sphere size precisely and accurately, which will reduce the uncertainty of the CMM measurements due to the variations in sphere size.
References:
1. ASME Y.14.5 –2009 Dimensioning and Tolerancing
2. Coordinate Measuring Machines and Systems, John A.Bosch ,1995, ISBN: 0-8247-9581-4
3. ASME B46.1-2002, Surface Texture, Surface Roughness, Waviness and lay
4. ANSI/ABMA std.10A – 2001, Metal Balls for Unground Bearings and other uses