

It’s Calibrated…Now What?
Metrology’s Impact on the Process
Now that the customer has received the equipment back from the Calibration Service Provider (CSP) there are potentially pages and pages of data, which leaves many questions:
- How do you apply this information to your process?
- Did the unit meet the specification requirements set forth by the customer’s purchase order?
- If not, was the purchase order as specific as needed to convey the customer’s requirements?
- If so, were there any Out of Tolerance (OOT) conditions that would be of any concern?
- How did the uncertainty of the calibration affect the measurements of the customer’s process?
The documentation provided by the CSP should help answer these kinds of questions. It is the customer’s responsibility to ensure the calibration received meets their process requirements. The cal lab may or may not know how the customer is using the instrument . . . most likely they don’t.
The examples used in this paper will include a digital multimeter and a set of ring gages to apply to a broader audience. These instruments may have some measurements that do not have a Test Uncertainty Ratio (TUR) of 4:1, depending on the equipment (i.e., laboratory standards) and/or process used by the CSP. If the TUR provided by the CSP is only 2:1, this decreased TUR can have an impact on the process tolerances and, ultimately, the product.
This paper is applicable for all sectors of industry and business at any level within the traceability chain. However, the targeted audience (for the examples in this paper) is customers who use the instrument(s) in the manufacturing or service process.
This paper follows a theme that is continuous among three related papers, which will be presented sequentially. The first paper covers Business’ Impact on Metrology, presented by Howard Zion, while the third paper will discuss Metrology Practice Impact on Business, presented by Phil Mistretta.
The information provided in these three papers will benefit conference attendees by providing practical information and exploring the inter-relationships between Business Decisions, Metrology Practice, and Process Impact.
Introduction
Choosing a Calibration Service Provider (CSP) takes time and effort on the process owner’s part. A CSP is selected among many available in the marketplace and the test instruments are sent to them for calibration. Was the decision based on cost, quality or convenience? More importantly, does the calibration provided meet the needs of the process? The CSP can’t determine this for their customer.
Upon receiving the equipment back from the CSP, customers are provided with, potentially, many pages of documentation. Prior to using the equipment, a check should be performed to make sure the equipment wasn’t damaged in shipping (as this could influence the calibration). If possible, a function check is also done to verify functionality. While performing the function check, if there are any concerns the customer should contact the carrier or CSP promptly. Analyzing the paperwork is the next critical step in the receiving process. Does the CSP make a statement of compliance, if needed? If so, was the unit in or out of tolerance? If requirements were not specified in the purchase order (PO), the test report may only include data and uncertainties of the measurement but not specification limits. ISO 17025 does not require a CSP to calibrate to manufacturer’s specifications although it does require the CSP to confirm the customer’s requirements. Using two examples, a set of ring gages and a loop calibrator, this paper explores the process from the point where the customer receives the instrument back from the CSP (intolerance) to the point that the customer determines any impact on their process.
Mechanical Example: Receiving a set of ring gages back from the CSP
In the first example, the customer’s process is creating an axle with a diameter of 1.0000 inches (+0.0000 inch/-0.0005 inch) or 25.4000 mm (+0.0000 mm/-0.0127 mm). They purchased two class X cylindrical ring gages, one Go and one No-Go, to check the output of their process. In their PO, they requested the ‘as found’ data, ‘as left’ data and the measurement uncertainties. This information, found on the test report provided by the CSP, is important for analyzing the calibration impact on the process. Figures 1 and 2 show the sample test reports provided by the CSP.
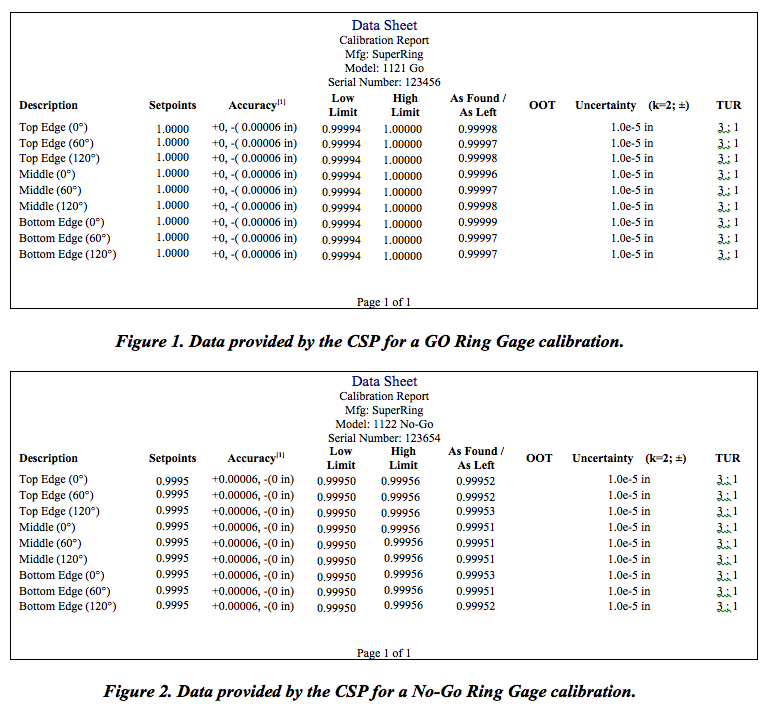
The first thing that should be done is a visual check of the Ring Gages to verify the gages were not damaged in shipping. After the visual inspection, a review of the certificate and data should be done. In Figures 1 and 2, the customer can see that the “As Found/As Left” data is within the accuracies listed for each gage. There are no marks in the out-of-tolerance (‘OOT’) column. The customer will also notice that there is not just one value to use for the ring gage, as might have been expected. As discussed in the prior paper and is reflected in Figures 1, 2, and 3, a round object when analyzed is not truly round. The CSP calibrates the ring gages to ASME B89.1.6 as is verified by the manufacturer’s website (or via phone). In this case, the CSP exceeded the ASME B89.1.6 mandatory requirements by providing nine readings for each gage, as opposed to the 6 points required by the B89 spec, “. . . diameter measurements spaced approximately 90° apart in each of three planes: the midsection and each end, . . .”. The ring gages would have failed if any of the readings exceeded the allowed tolerances (i.e., the ‘most wear’ condition in fig. 3).
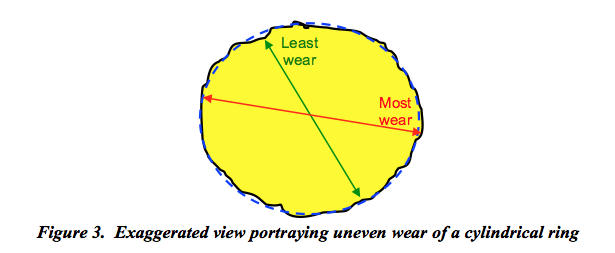
Does this meet the customer expectation considering the use of the ring gage? The customer purchased the ring gages with the assumption that they were manufactured and calibrated per ASME B89.1.6 for the sole purpose of checking the axles. At least wear condition will prevent any axles that are too large for the limit test from passing through the ring. So, if this minor diameter is within the calibration tolerance limits, this will not pose a problem to the measurement process for the axles. This thought process implies that the most wear condition does not necessarily have to remain within the calibration tolerance limits. The extension of reasoning here is that, if this ‘major diameter’ were to exceed the limits, then the minor diameter will likely prevent any shaft larger than the minor diameter from passing through the ring gage. Still, to minimize risk, both the minor and major diameters in an uneven wear condition are required to remain within the calibration tolerance limits so that it is assured that bad product won’t be allowed to pass through the process. A more thorough calibration, perhaps with a coordinate measuring machine (CMM), could have been performed to better ensure the roundness of the ring gages. However the note at the bottom of B89.1.6, section 4.5.1 indicates that, “. . . Perfect form at MMC is not required.”[1].
Since the calibration of the gage passed, it can be used by the customer. The next paper in this series will discuss the situation for a failing ring gage and will investigate the effect of the calibration results on the process requirements.
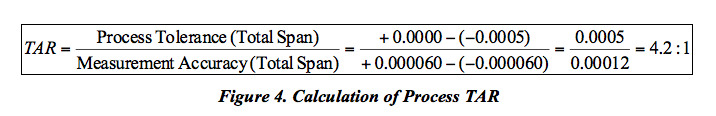
What the customer should already know is the TAR (Test Accuracy Ratio) between the Ring Gage and their process. Since both ring gages are used to check a single process, the logic on how to determine TAR in a Go/No-Go application can become a bit tricky. It helps to look at the span of the tolerance for the process (0.0000 minus -0.0005 = 0.0005) and the span of the tolerance for both ring gages combined (+60 µin minus -60 µin = 120 µin) rather than taking these on separately. The result shown in figure 4 is a TAR of 4.2:1. The ratio indicates the impact the ring accuracy has on the customer’s process. The ring gage tolerance in this example is not going to have a significant impact on the process.
What the customer may not realize is that looking at just the tolerance of the rings could be misleading. Calculating the TAR doesn’t consider any other factors such as the CSP’s measurement uncertainty that could affect the process. Without the CSP’s uncertainties, the customer would have no way of knowing how much error the calibration may have introduced into their process. The data provided by the CSP in the uncertainty column of Figures 1 and 2 is one of those factors. Recalculating for the Test Uncertainty Ratio (TUR) using the CSP measurement uncertainty is a little more complicated since the measurement uncertainty is bilateral (it is + and – around the nominal value). The uncertainty of the CSP is ±0.000010 or ±10 µin. for each ring gage. Both should be included in the uncertainty budget for the use of these rings in the measurement process for the diameter of the axles. The overall uncertainty of the calibrated Ring Gage is then calculated. This is done by root sum squaring (RSS)[2] the combined tolerance of the rings (±0.00006) and the CSP uncertainty (±0.00001) for each ring gage, which equals ±0.0000707. The process tolerance (0.0000 minus -0.0005) is then divided by the span of the expanded measurement uncertainty for the limit gages. This is shown in Figure 5 (Note: the divisors for Rectangular and Normal distributions are 1.732 and 2, respectively).
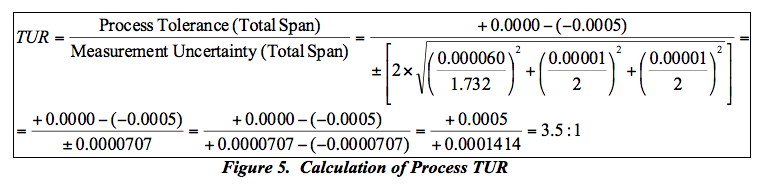
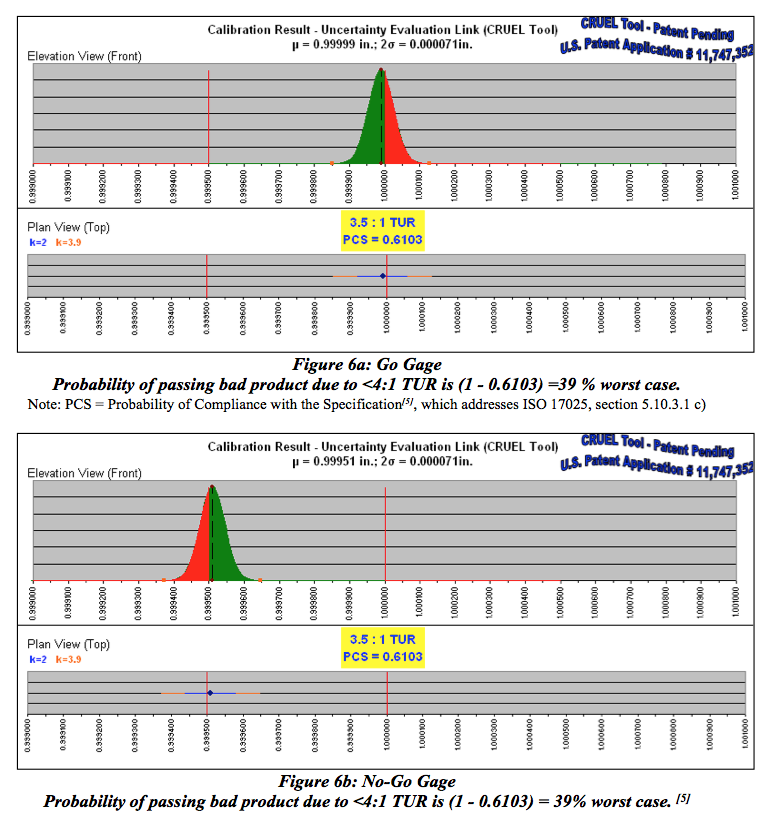
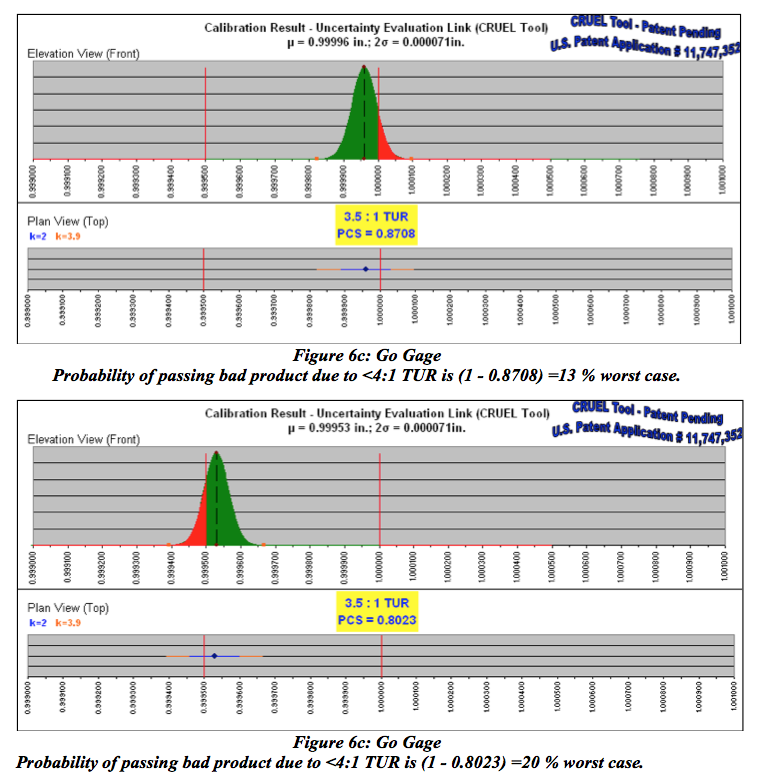
Accounting for the additional error from the CSP’s measurement uncertainty, this has changed the estimated relationship between the axle and the limit gages from a TAR of 4.2:1 to a TUR of 3.5:1. The customer does a risk analysis and determines that at the worst reading for the Go ring gage (0.99999 inches) there is a 39% chance that axles as large as 1.00014 inches were passed (based on the Go ring tolerance, the actual values in the test report, and the uncertainty of the measurement; see fig. 6a). At the worst case reading on the No-Go ring gage (0.99951 inches), there is a 39% chance that axles as small as 0.99938 inches were passed (see fig. 6b). However, since these ring gages are not perfectly round, the least wear points on the limit gages would likely have prevented these extreme axle sizes from being allowed to pass the limit tests. The best case would be the Go ring gage allowed 13% (see fig 6c) and the No-Go allowed 20% see fig 6d) (again based on the ring tolerance, the actual values in the test report and the uncertainty of the measurement). Although the TUR has historically been an important indicator it doesn’t give all the information required to evaluate risk. It is the more important to understand the relationship between most wear point, tolerance of the ring gages and CSP’s uncertainty in order to see if a significant impact on the process has occurred. At this point, the customer has accounted for the CSP’s impact on the process and must decide whether the risk is acceptable. There may be other contributing factors, such as local environment or operator variability, in the customer’s process that could affect the TUR or risk and should be included in the denominator of the equation in fig. 5, however, those will not be discussed in this paper.
Evaluation of a Loop Calibrator
In the second example, the customer is going to use a loop calibrator that was just calibrated to test panel meters in their facility. The panel meters are used to read the loop current from several pressure transducers that monitor system pressures across the plant. After sending the loop calibrator to the CSP, the customer received the following information (see figure 7). The data provided by the CSP tells the customer that the loop calibrator was intolerance and the CSP has also provided the as found, as left and the uncertainties of the measurements (as stated on the customer’s PO).
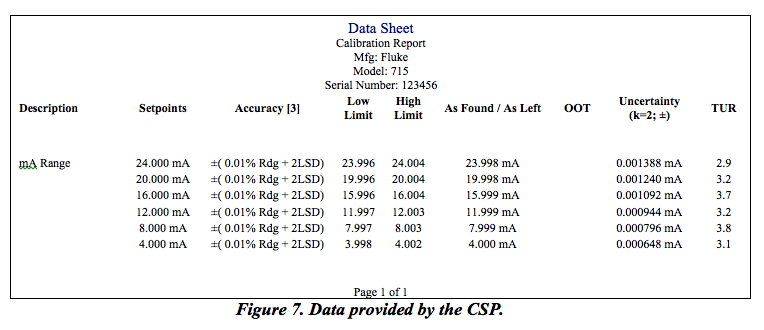
However, in the TUR column, the CSP has calculated the TUR based on the uncertainties provided. All the points for this calibration were less than 4:1. The customer’s quality system requires that all calibrations have a 4:1 ratio, however through a clerical error, the PO didn’t have any requirements for a minimum TUR of 4:1. The quality system of the CSP only requires that they report the information to the customer, which they have done. Since the CSP’s uncertainty is less than 4:1, it could have an effect on the calibrations the customer is going to perform with the loop calibrator. Again, as in the previous example, an evaluation must be done to determine the impact. This is done in the same manner illustrated above, however this time all the accuracies and uncertainties are bilaterally symmetrical. The panel meters’ accuracy is ± (0.05%FS + 1 LSD). If the customer calibrated the panel meters using the same format and at the same test points used by the CSP it might look something like Figure 8.
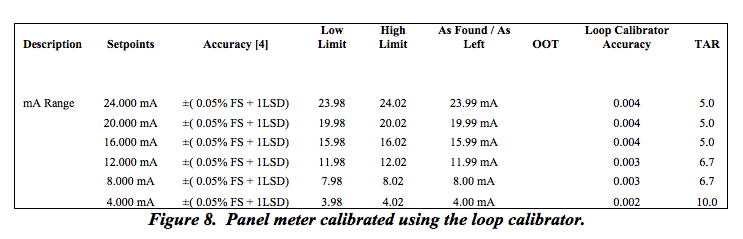
Notice that the uncertainty column and the TUR column have been replaced with the Loop Calibrator Accuracy and TAR. In figure 8, the customer calculated the TAR. The TAR’s indicate that the loop calibrator accuracy is sufficient to test the panel meters with little effect on their accuracy, therefore not affecting the process.
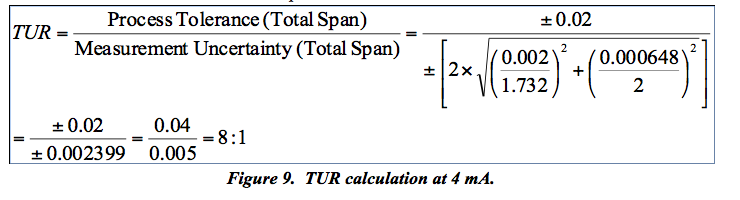
In this example, the uncertainty of the CSP could have a greater effect on the process. The customer will need to calculate the TUR by including the uncertainty of the calibration from the CSP. As seen in the Ring Gage example, a TUR is a more complete estimation of uncertainty than a TAR. The customer will calculate the TUR the same way as before. In figure 9 the TUR calculation is shown for the 4-mA test point.
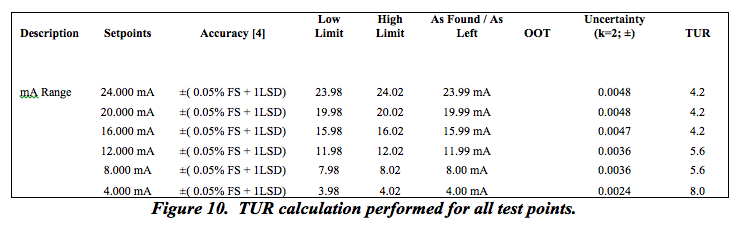
This same calculation, performed at each test point, is shown in Figure 10. The uncertainties in figure 10 are the RSS [2] combined values of the accuracy of the loop calibrator and the calibration uncertainty of the loop calibrator for each individual test point.
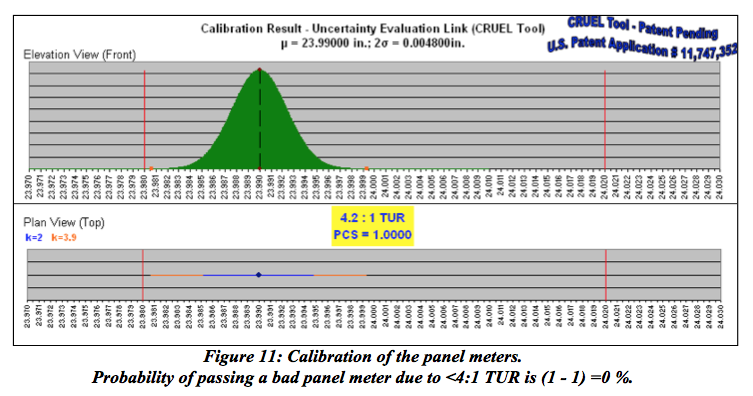
The customer again must do a risk analysis to determine the impact on the process. In Figure 11, 23.99 mA was used to do the risk analysis. This shows there is a 0% chance that a bad calibration was performed on the panel meters. Had the reading been at 23.98 mA there would have been a 50% chance that an out-of-tolerance panel meter was passed.
What the customer sees is, with this calibration result, the CSP’s uncertainty had little effect on the calibration of the panel meters. The loop calibrator, in this case, would not necessarily need to be recalibrated to a 4:1 TUR so would not add anything to the process. But it is only after doing the analysis above that we would be able to make this determination. The following paper will discuss the possibilities of out of tolerance conditions and limited calibrations.
Conclusion
It is the customer’s responsibility to evaluate the information received from the CSP and determine the impact. In either of the examples, the CSP wouldn’t have known how the instruments were going to be used or for what process. Analyzing the impact of the information provided by the CSP can be very important to the performance of the process. The calibration uncertainty supplied with each set of data is an integral part of that information. Implementing concrete rules in a quality system regarding TUR’s can end up being costly and inefficient if done without an understanding of their ultimate impact on the process. As seen in both examples, there was the potential for all processes to be affected by the calibration uncertainty from the CSP. However, even with the CSP’s uncertainties resulting in TUR’s of less than 4:1 in the second example, there was no negative impact on the process. Had the customer not evaluated the situation and blindly followed the >4:1 TUR directive in the quality system and returned the items to be recalibrated, it would have resulted in additional time and expense with no value added to the process.
Attachment 1: References
- American Society of Mechanical Engineers B89.1.6-2002, Measurement of Plain Internal Diameters for use as Master Rings or Ring Gages, 31 Dec 2003.
- Barry N. Taylor and Chris E Kuyatt, NIST Technical Note 1297, 1994 Edition: Guidelines for evaluating and expressing the uncertainty of NIST measurement results. Sep 1994.
- Fluke Corporation, 23 April 2008, http://us.fluke.com/usen/products/specifications.htm?cs_id=1708(FlukeProducts)&category=LOOPCAL(FlukeProducts)
- Hoyt Electrical Instruments Work Inc., 23 April 2008
- Howard Zion, Metrology Concepts: k=3.9? . . . Why Not??, 2007 Measurement Science Conference.
About the Speaker
Jeremy Sims is the Quality Manager for Transcat, Inc. He received his metrology training in the U.S. Navy in Biloxi, MS in 1997. Jeremy continued his Navy career at Naval Air Station North Island in San Diego, CA. From there, he moved to Austin, TX in 2000 where he worked for Ion Implant Services as a Machine Technician/Operator. Jeremy joined Transcat as a Calibration Technician in St. Louis, MO in 2001 before accepting his appointment to his present position in 2005. He received his Certified Calibration Technician status through the American Society for Quality in 2004. He is currently pursuing his B.S. degree in Electrical Engineering.